

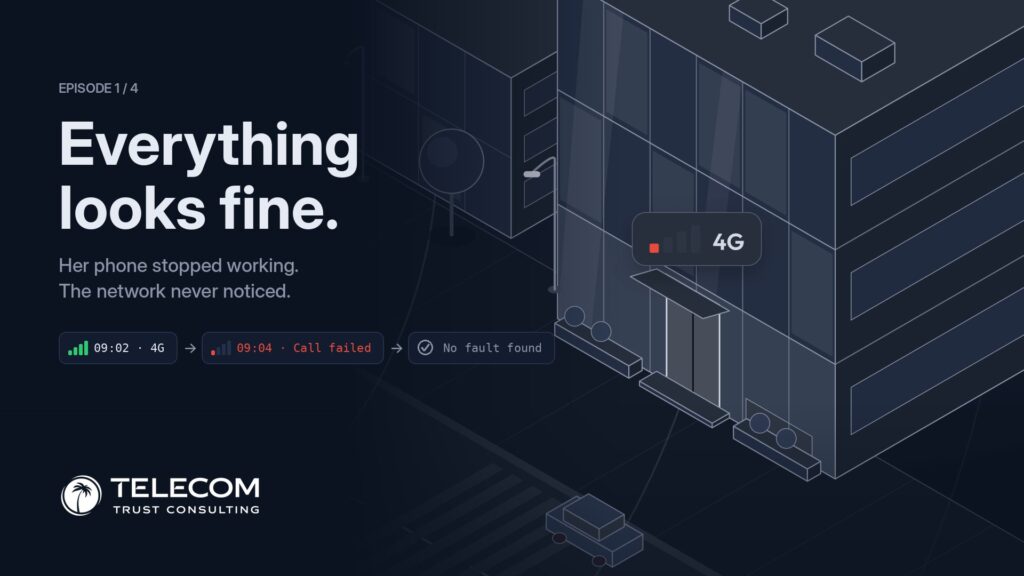
A customer can lose service completely while every screen at her operator stays green. That gap between what the network reports and what the phone actually experiences is one of the least visible problems in mobile telecoms.
Two minutes that never show up on a dashboard
It is 09:02 and a woman is walking to her office, phone in hand. Four bars, 4G, everything normal. She steps through the glass doors and the signal starts to fade: concrete, coated glass and steel absorb what the tower outside is sending.
What happened, minute by minute
Why the dashboard stays green
She calls customer care from the office landline. The agent opens the network panel and sees exactly what he is supposed to see. Nobody is lying: the network really is fine, by every measure the network can take of itself.
Same moment, two screens
Operators judge service mostly from inside the network: cell counters, alarms, drive tests and predicted coverage maps. Those tools answer the question “is my equipment working?” They were never built to answer “can this customer, on this phone, in this room, make a call right now?” The gap opens in three places:
- The last few metres. Coverage maps are predictions. They do not know about one building’s coated glass or a basement meeting room.
- Failures that never reach the network. If a phone gives up before its request arrives, there is no failed call to count. Silence looks like health.
- Averages. A cell serving thousands of users can show excellent figures while a small group in one spot has no usable service at all.
What a year of measuring from the phone revealed
This is not only a story for an animation. One mobile service provider measured its customers’ experience directly on their handsets for twelve months. Several findings were invisible from the network side.
The study at a glance
1. A town disappeared from the network, and nobody noticed
In one municipality, the share of readings carried on the home network collapsed within weeks and never came back. The antennas kept radiating, so nothing was switched off. Customers simply moved onto other networks and kept working, which is exactly why every internal counter looked healthy.
Share of readings on the home network, one municipality
It stayed between 0.20% and 0.29% for the following eleven months. No alarm was raised, because no equipment failed.
2. Full bars, no calls
On an LTE-only network there is no older 2G or 3G layer for voice to fall back on. If the phone is not registered for voice over LTE, it cannot call, even while it shows service. The coverage map was right about the signal. The customer was right about the call.
Signal on screen, voice not available
3. The support queue does not track the pain
Customers who rarely lost service and customers who were without it more than half the time opened tickets at almost exactly the same rate. Ticket volume is a poor map of where the network fails.
Customers who opened a ticket, by time spent without service
Ten times worse service, the same number of complaints. Tickets raised through the operator’s app, counted per customer.
4. An average can hide a whole group
In one municipality, the typical customer was fine. The worst-served tenth was not, even though both groups used the same cells. The difference was distance: that is a coverage-extent problem, which needs a new site, not a maintenance visit.
Same cells, two very different experiences
Share of time below the service threshold
5. Sometimes the bars mislead the customer too
How a handset turns received power into bars varies by manufacturer. Part of what customers blame on the network is decided inside the phone, which is one more thing the network cannot see.
When the phone showed “no signal”
■ 76% — usable power was reaching the phone
■ 24% — the signal really was too weak
The same pattern repeated on three other networks measured the same way (78% to 85%).
Where the blind spots are
The same pattern repeats: the network reports on its own equipment, while the failure happens at the edge, inside a building, a handset or a small group of users.
None of these raises an alarm, because from the network’s point of view nothing is broken.
Closing the gap
The fix is not to distrust network tools. It is to add the missing point of view: the customer’s own device. A phone knows its signal level, which cell it is on, whether it is registered for voice, how it is configured and whether its last call went through.
What changes when you measure from the device
It also requires discipline. Device data must be anonymised, counted per customer rather than per reading, and checked against network records before anyone acts on it.
Everything looks fine, until you look from the phone
In our story, the agent did nothing wrong. He followed the dashboard, and the dashboard was accurate about the network. It simply could not see the room where the customer was standing. For most customers, the network is whatever their phone shows. If operators only look from the network side, “no fault found” will keep closing tickets that were never solved.
Your network can’t see what the phone sees.
Episode 1 of 4 · Next: what changes when you can